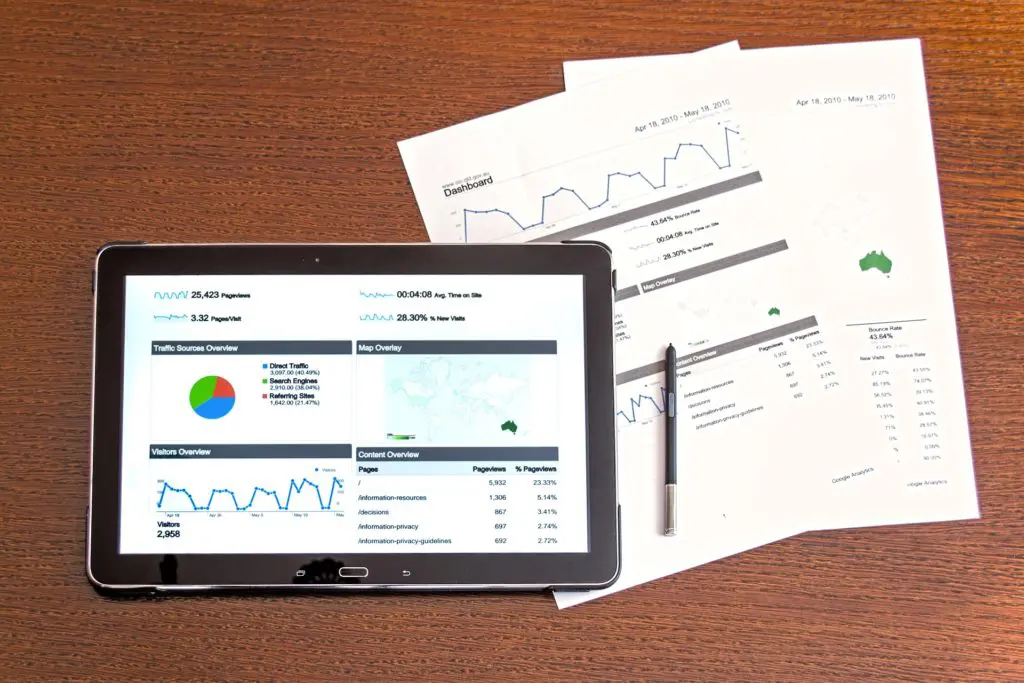
We love data. We would go as far as to say nothing makes us happier than using real data to show our clients how great their campaigns are performing. Data such as sales leads, website traffic, and social media engagement can all be used to show the impact of marketing on business performance, and help guide future decisions. But when it’s stored in boring Excel spreadsheets, it’s not very useful.
Enter dashboard and reporting tools! The following tools help streamline and visualise your data to give your business a greater level of insight – generally with a level of automation not available in Excel.
Here are some of our favourite reporting tools that we here at Threesides use to make client reporting easier and effective:
Swydo
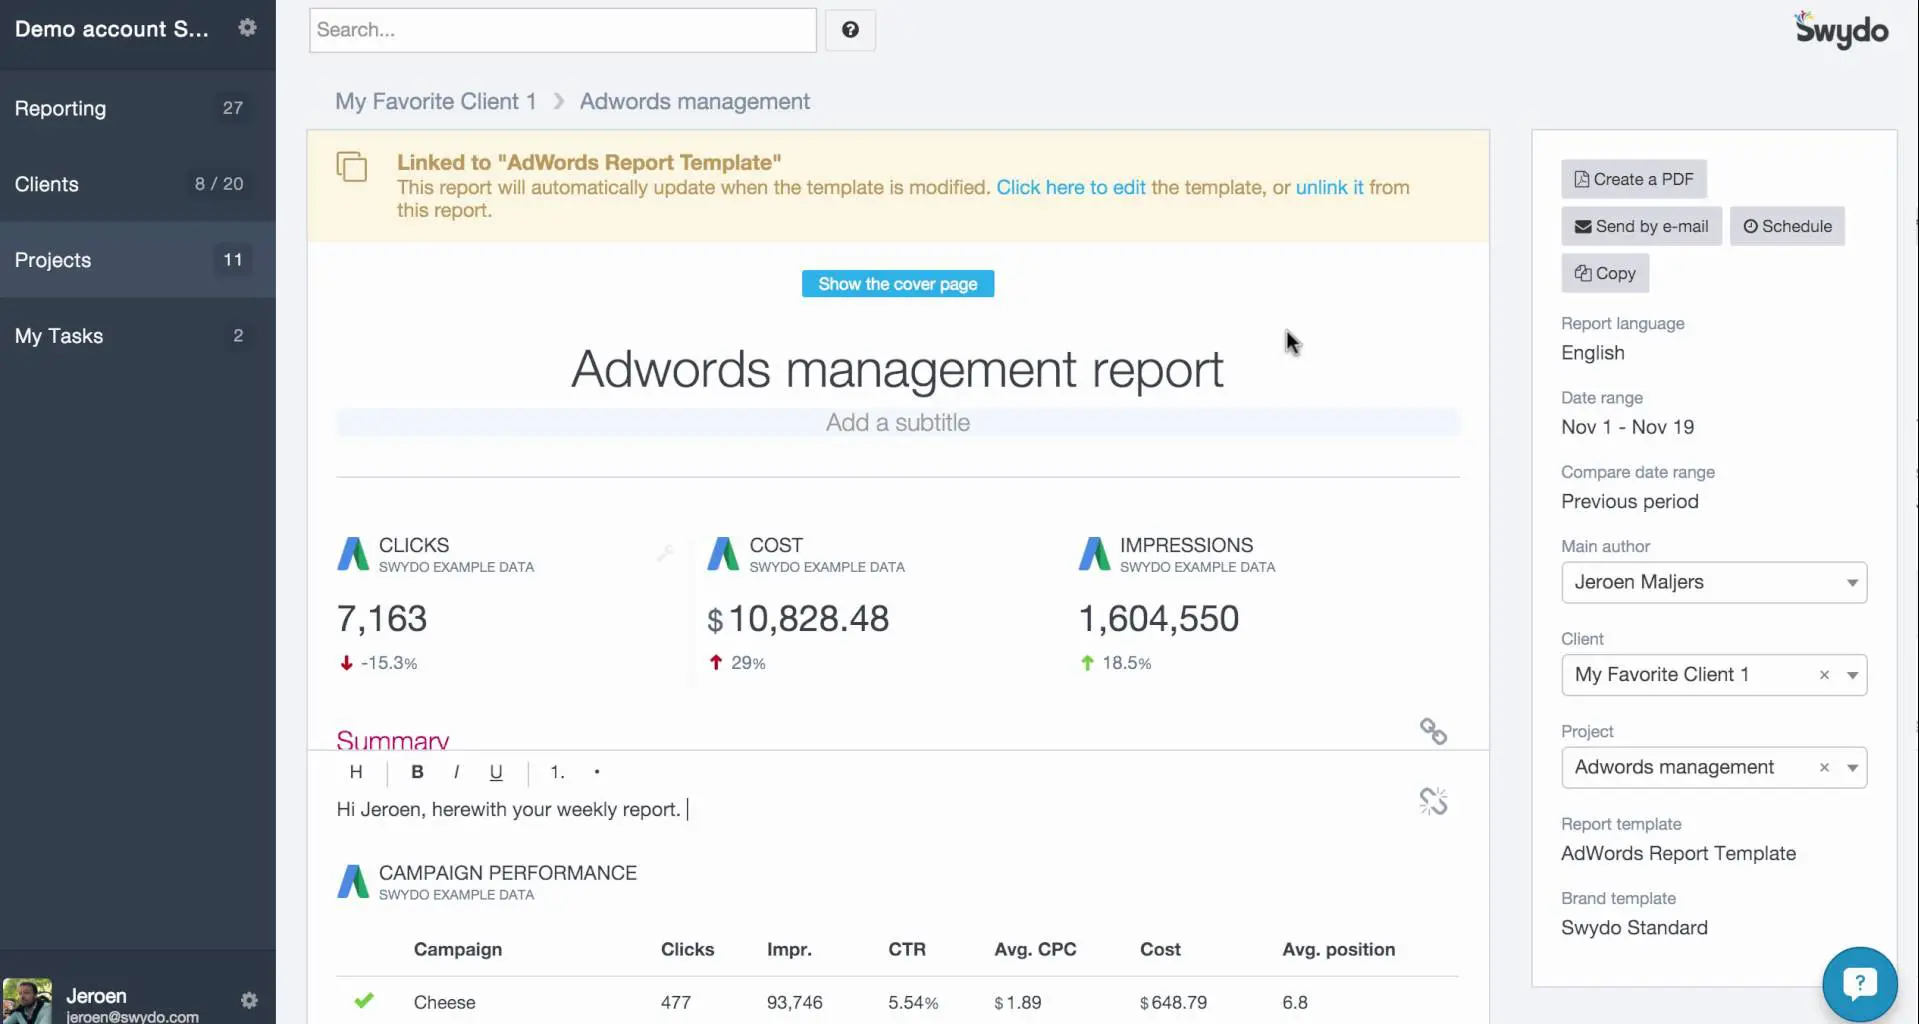
Swydo is a web based reporting tool for campaign monitoring, PPC and analytics. With integration with Google Ads, Bing Ads, Facebook Ads, Google Analytics, Webmaster Tools, and more, Swydo is great for creating custom business reports that focus on digital marketing performance, especially Google Ads and Facebook.
We love the fact that it includes options for creating custom date ranges, custom date ranges, company logos, KPI widgets, layouts and colours. Additionally, scheduled reports can be setup that can automatically be emailed to the designated person.
We use Swydo to create engaging and effective PPC and/or Facebook Campaign timely reports that are easy to read and perfect for our busy clients that are interested in a brief overview of their campaign performance.
Pros
- Easy to use and learn
- Quick to generate report once template is setup
- Integrates with Google Ads, Bing Ads, Facebook Ads, Google Analytics and more
- Includes a lot of customisable options such as date ranges, text, KPIs and filters
- Includes unlimited automated reports
Cons
- No Hubspot, Excel, API or custom widget integration
- Highly focused on PPC reporting
- Data visualisation is average
- No financial tools available
CYFE
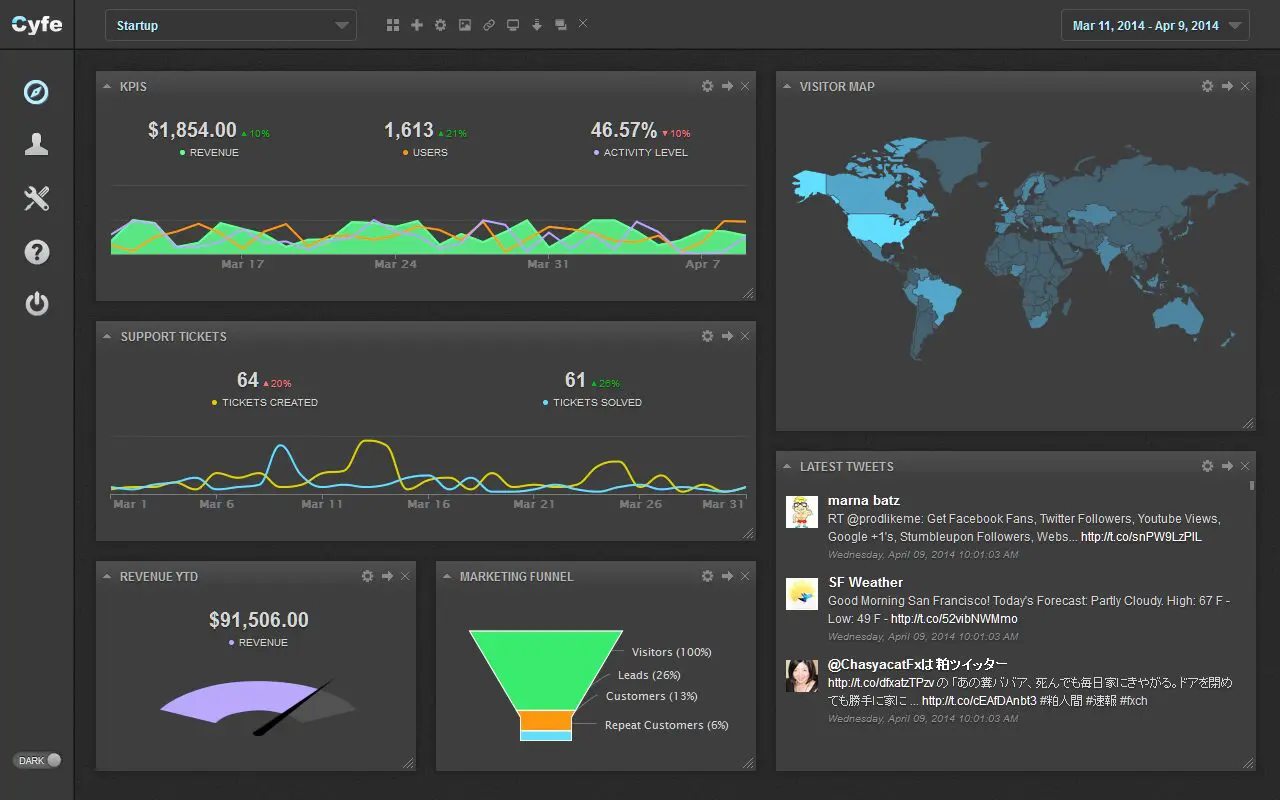
Cyfe is online business dashboard tool that helps monitor and analyse data across different accounts. Along with its integration with Google Spreadsheets, Cyfe can pull data from all the various analytics platforms such as Google Analytics, Google Ads, Facebook, Shopify, Mailchimp and more, and put them into one dynamic dashboard.
Cyfe is full of benefits for online marketers, some of its cool features include unlimited dashboards and custom widgets, real time data and custom domains.
Data HQ, our own Cyfe platform helps us easily monitor campaign performance and share analytics data from real-time that is on a single beautiful visual dashboard, with our staff and clients. It’s also perfect for displaying on TVs for marketing meetings.
Pros
- Unlimited dashboards and widgets
- Unlimited users
- Dashboard sharing
- Real time data
- Custom widgets and other channels included
- Unlimited reports
- Includes TV Mode functionality
- Value for money
Cons
- Only includes widgets
- Limited metrics and filters on each widget
- Focus on Analytics data
- Slow at times
- Reports need to be exported
Google Analytics Dashboards
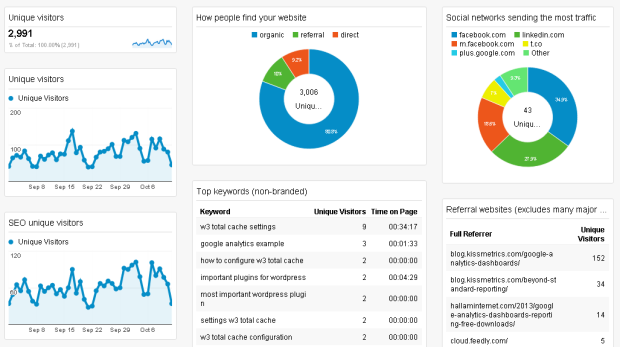
Google Analytics is a free web analytics tool from Google that provides website traffic insights. If you have a website, you probably already have Analytics installed, and can help provide you visually appealing insights on various campaigns, if properly setup.
While reporting isn’t its key feature, the reporting and dashboard functions do have some surprises including real time data, Google Ads integration, UTM tracking and shared dashboards.
As one of the few Google Certified Partners in Canberra, we’re experts in the setup and management of Google Analytics accounts, and receive great insights and trends on website analytics. While we do not use Google Analytics reporting much, some reports help us access data and KPIs very easily that are used in other reports. Although Data Studio is great new alternative.
Pros
- Free
- Includes real time reporting
- Can export shared dashboards from the web
- Visually appealing
- Great for acquisition data
- Allows sharing
- Allows UTM tracking
Cons
- Hard to track other marketing platforms
- Complicated to use
- Website traffic focused
- Cannot compare multiple sites’ data
Google Data Studio
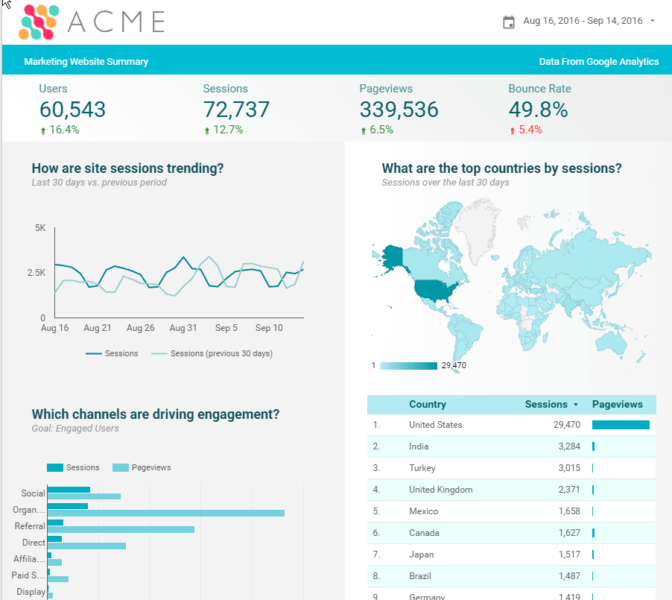
Google Analytics is not the easiest tool to use and data might be hard to understand. Enter Data Studio, Google’s latest free dashboard and reporting tool for creating custom reports. While currently in beta, Google Data Studio is built for data visualization by making it simple and easy to pull information from Google Analytics, Google Ads and Google Sheets.
If you love gorgeous looking reports like we do, Data Studio might be a great option. By including custom colours, fonts, real time data, financial reporting metrics and unlimited reports, it’s hard to ignore this free tool.
We have used Data Studio to convert some of our boring spreadsheets into more visually looking reports. Since its still being improved, we wouldn’t recommend it to our clients today, but it does hold a promising future.
Pros
- Free
- Includes Real time reporting
- Visually Appealing
- Easy to read and use
- Includes financial reporting metrics
- Unlimited reports
- Can import data from Google Sheets
- Great for Google Ads and Analytics Reporting
Cons
- Beta – a bit more buggy, not much customer support
- Google Products focused
- No Hubspot or custom widget integration
- Not many data filters available
- No automatic schedule
Klipfolio
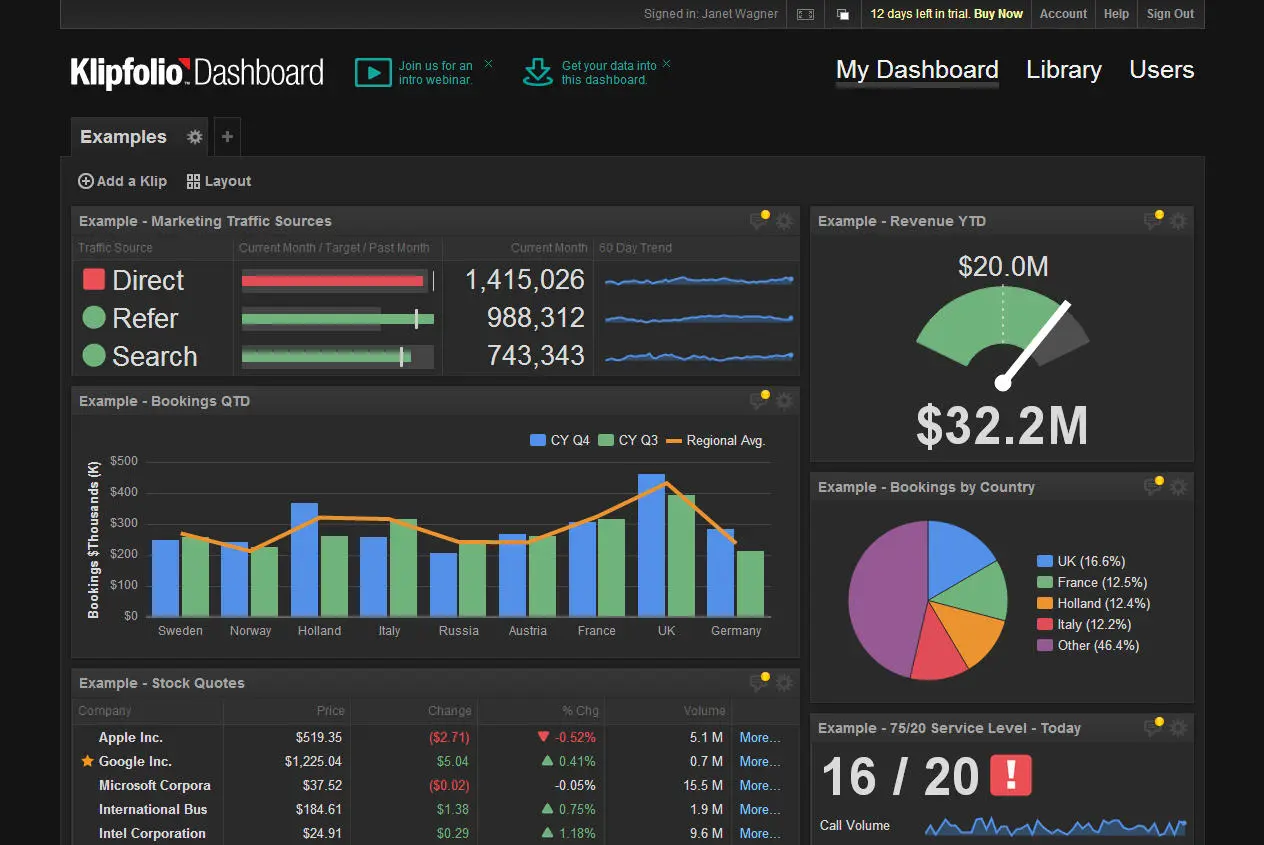
Klipfolio is a dashboard platform tool for custom business performance dashboards. With hundreds of integrations with other services including social media, technology, marketing and sales and finance, Klipfolio can be used to capture data from different areas of the business.
While its more of a Business Intelligence tool and developer oriented, it includes 400+ data sources, functions and automations, easy sharing and API access. Not bad.
Ideal for medium to large businesses that have different functional areas, we use Klipfolio to monitor our larger clients’ various marketing and sales performance, and for quicker decision making.
Pros
- Developer capablities
- Focus on real time reporting
- Integration of 400+ data sources
- Can include data from all business areas
- Includes functions and automations
- Includes API access by default
- Good customer service
Cons
- More customisation generally needed
- Not the cheapest option
- Takes more work to be as attractive as other options.
- Limited features depending on plan
[/vc_column_text][/vc_column][/vc_row]

